“While it is unfortunate that it took more than a year and hundreds of thousands of taxpayer dollars to resolve this matter, the positive news is that we will be able to utilize the data-driven analysis to reorganize DPI to help the agency focus on its core mission of supporting educators, students and parents across North Carolina.” – Mark Johnson (6/8) on the Supreme Court decision in case with SBOE.
The idea of using data to drive policy is not a new occurrence. But it is sometimes hard to quantify the qualitative aspects of public education. Some officials like to look at proficiency levels and scores. Teachers tend to look at growth. One is a snapshot. The other is a look at the terrain traveled.
But if Mark Johnson is now going to use some data-driven analysis, there is some irrefutable data that provides a very clear picture of what can be done to help public education here in North Carolina.
1. Poverty Influences How Well Students Perform in a State Where Over 1 in 5 Public School Students Lives in Poverty
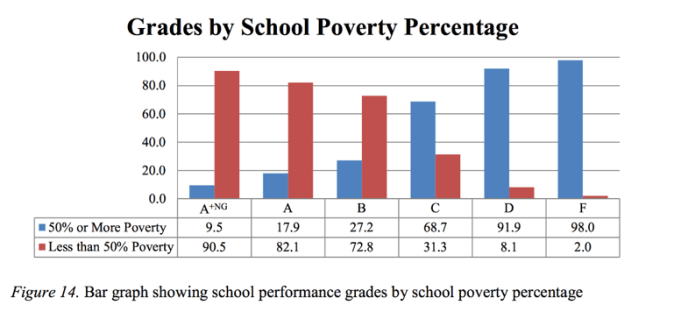
That is from the 2015–16 Performance and Growth of North Carolina Public Schools Executive Summary, NC DPI.
In Sept. of 2016, Mark Johnson said, “The transformation of our public education system will open true pathways out of poverty” (https://www.ednc.org/2016/09/07/our-american-dream/).
Maybe attacking poverty at its root sources could do so much to help education. The data tends to show that.
2. Average is Not Actual When It Comes To Teacher Pay
Johnson and the people he allies himself to in the GOP super majority take a lot of time talking about how “average” teacher pay has risen.
Here’s a data point.
- In 2017 the average teacher pay in North Carolina was %16 behind the national average. In 2018 the average teacher pay in NC was STILL %16 behind the national average.
Consider the following table compiled by John deVille, NC public school activist and teacher veteran who has chronicled the various changes in educational policy for years. He tracked the recent teacher pay “increase” and used DATA-DRIVEN logic to show something rather interesting.
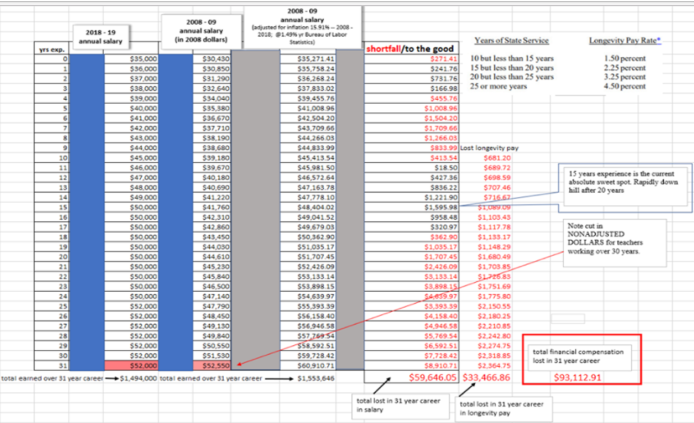
What deVille did was to compare salaries as proposed from the recent budget to the 2008-2009 budget that was in place right before the Great Recession hit, the same financial catastrophe that most every GOP stalwart seems to forget happened ten years ago. Adjusting the 2008-2009 salary schedule with an inflation index from the Bureau of Labor, the third column shows what those 2008-2009 salaries would be like now. Most steps see a shortfall. Add to that the loss of longevity pay that was used to help finance these “historic raises” and the amount of money lost by teachers over these past ten years becomes rather eye-opening.
Also notice that the biggest shortfalls happen to veteran teachers. That not only affects take home pay, but also retirement because the average of the last four years helps to project pension.
Look at the charts below from the recent Teacher Working Conditions Survey released by Johnson’s office this past week.

Take notice of the number of veteran teachers in the state. Compare that to the number of teachers in the state who have less than ten years experience. There’s a trend going on in teaching here in NC. More teachers are leaving the classroom at earlier times in their career. The number of veteran teachers in the state will drop as years go by.
Even Mark Johnson left the classroom after two years. That’s a data point.
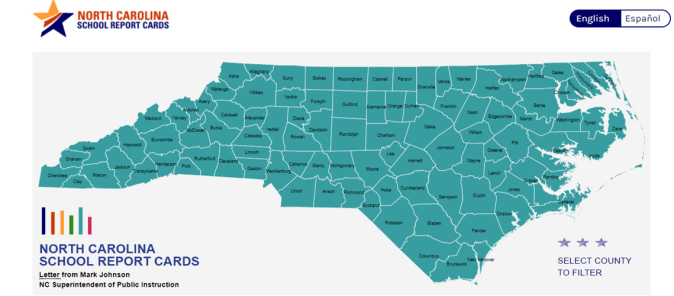
3. Public Education is the Top Employer in Most Counties
North Carolina has 100 counties (with 115 LEA’s), each with a public school system. According to the Labor and Economic Analysis Division of the NC Dept. of Commerce, the public schools systems are at least the second-largest employers in nearly 90 of them—and the largest employer, period, in almost 70. That means teachers represent a base for most communities, the public school system. And teachers are strong in numbers.
If people went to the polls in November and had public education as a top priority and had unspun information helping to inform decisions on whom to elect, then there could be significant change occurring quickly.
4. When Lawmakers Say They Are Spending More on Education, It Doesn’t Mean That Per-Pupil Expenditures Have Risen
Here’s a recent Facebook post from Senator Joyce Kraweic.
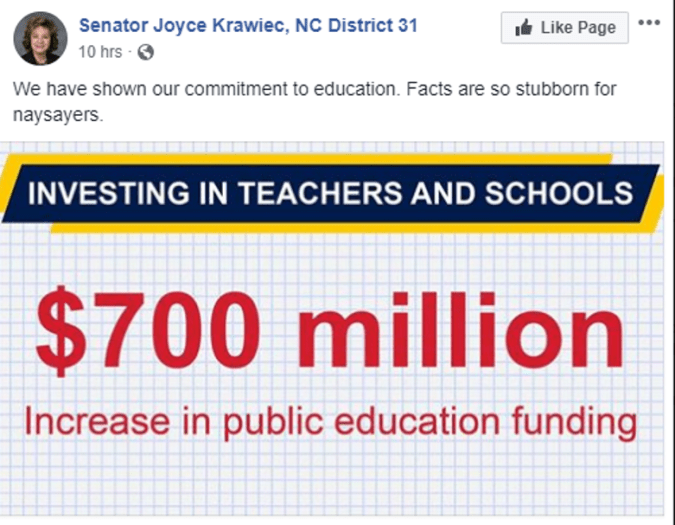
Say in 2008, a school district had 1000 students in its school system and spent 10 million dollars in its budget to educate them. That’s a 10,000 per pupil expenditure. Now in 2018, that same district has 1500 students and the school system is spending 11.5 million to educate them. That district is spending more total dollars now than in 2008 on education, but the per-pupil expenditure has gone down – significantly to over 2300 dollars per student or 23 percent.
What many in Raleigh like Kraweic want to pat themselves on the backs about is that we as a state are spending more on education than ever before. And that’s true. Just listen for the many examples to come from legislators looking to get reelected this year to the NC General Assembly yet passing a budget through a nuclear option to avoid having to answer questions about the facts.
But when the average spent per pupil does not increase with the rise in the cost of resources and upkeep and neglects to put into consideration that the population of North Carolina has exploded in the last couple of decades, then that political “victory” becomes empty.
5. Lots of Teachers Already Know These Data Points