This week it was reported that the College Board would be applying a score to a student’s SAT performance that is linked to that student’s socioeconomic status. From CNN.com.
The nonprofit group that administers the SAT said Thursday it will assign a score to students who take the test to reflect their social and economic backgrounds.
The new score — first reported by the Wall Street Journal — comes amid heightened scrutiny that colleges are facing over the admissions process and the diversity of their student bodies.
The College Board said it would implement what it calls the “Environmental Context Dashboard,” which would measure factors like the crime rate and poverty levels of a student’s neighborhood, to better capture their “resourcefulness to overcome challenges and achieve more with less.”
“There is talent and potential waiting to be discovered in every community — the children of poor rural families, kids navigating the challenges of life in the inner city, and military dependents who face the daily difficulties of low income and frequent deployments as part of their family’s service to our country,” David Coleman, chief executive officer of the College Board said in a statement sent to CNN.
“No single test score should ever be examined without paying attention to this critical context,” he added.
“Non-profit” might be a bit of a misnomer for describing the College Board and the amount of money that it takes in for all of the different “services” that it provides. The fact that it is trying to consider other factors into its scoring process is a little interesting. But this post is not trying to debate the merits of this system in evaluating students by a national standardized test. It’s more about if outside influences has an effect on student performance. (They do).
That the SAT is skewed toward students from more affluent backgrounds is pretty well known. And the time it has taken for them to make this possible “PR” move might be taken by some as welcome. Or not.
Here is what is measured according to the College Board.
All data is aggregate and based on census tracts. Here’s what’s included:

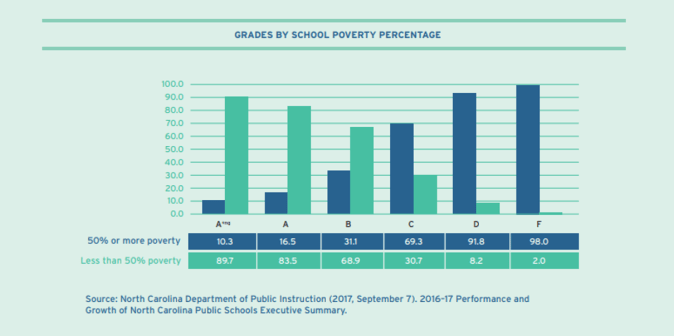
So when looking at family income, poverty, food insecurity, educational attainment by parents, employment stats, crime rates, etc. based on both household and neighborhood stats, would that add perspective to any standardized test given in NC or even to those incredibly skewed school performance grades?
Imagine the use of an “adversity” factor from a dashboard.
And Mark Johnson loves a dashboard.
And imagine whether or not the NCGA would even give credence to such information and the effect of outside influences on schools and student performance.
