As Winston-Salem/Forsyth County Schools begins to send more and more students back into school buildings, the dashboard that the district uses to report how it views the data concerning the pandemic shows a system built on self-reporting.

It states,
“Current reported confirmed cases are defined as cases that indicate a lab result confirming the diagnosis. For them to be considered current the individual will be within their 10 day isolation period. Once this period has concluded, the case will be removed from the dashboard based on the NC StrongSchools Toolkit guidance. Isolation periods begin the day after the reported symptoms start of if no symptoms, the reported date of the test.“
Here’s today’s data as of early this morning:
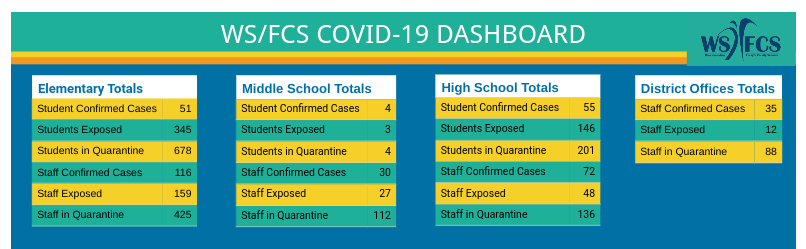
That’s cumulative data.
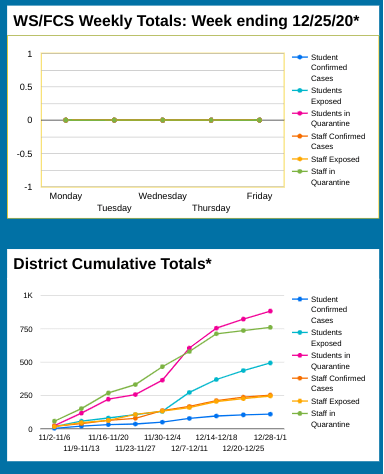
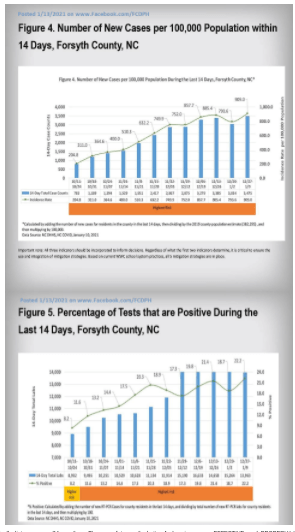
And recently these tables were added:


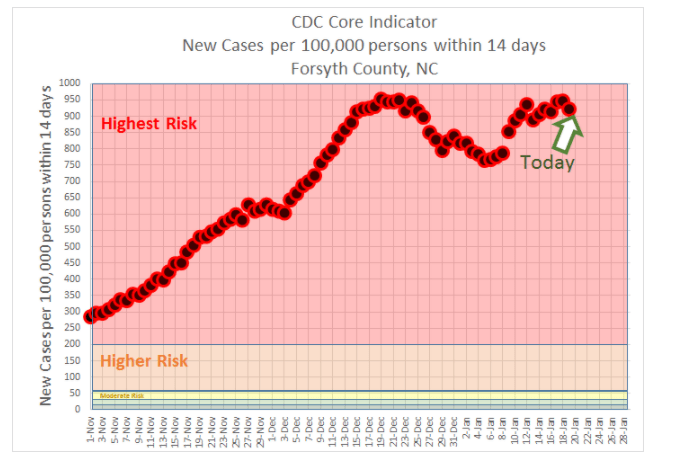
Now look at this dashboard put together by a consortium of people in the county who want to make sure that we can see the data from a different angle that creates a better snapshot of not only the cumulative data but also of the current risks.
And what is seen is really not what the school system dashboard is showing. Again, this is the data shown this morning.
This dashboard also has the tables that the school system have now put on their dashboard, but they have always had those data tables.
The second dashboard also breaks down the data in an accessible manner.
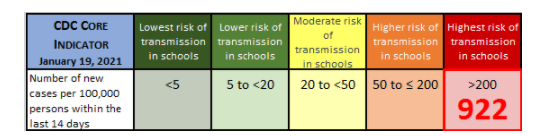
And this is rather eye-opening:
Risk assessment for WS/FCS employees: One common assessment tool to determine if risk mitigation strategies are being being implemented consistently and correctly is comparing incidence of new cases between two groups. Here we compare case incidence between WS/FCS employees and the general population of Forsyth County. Let’s start with incidence in Forsyth County between Nov-2 and Nov-11. Over that time period, there are 1075 new COVID-19 cases in Forsyth County. This works out to 2.8 cases per 1000 Forsyth County residents. For that same time period, 30 new COVID-19 cases were reported for WS/FCS employees. This works out to 4.2 cases per 1000 WS/FCS employees. This is bad news for WS/FCS employees. This strongly indicates the current districtwide risk mitigation plan is insufficient and not working. Worse yet, this data suggests that WS/FCS employees have a 50% higher COVID-19 exposure risk than the local population.
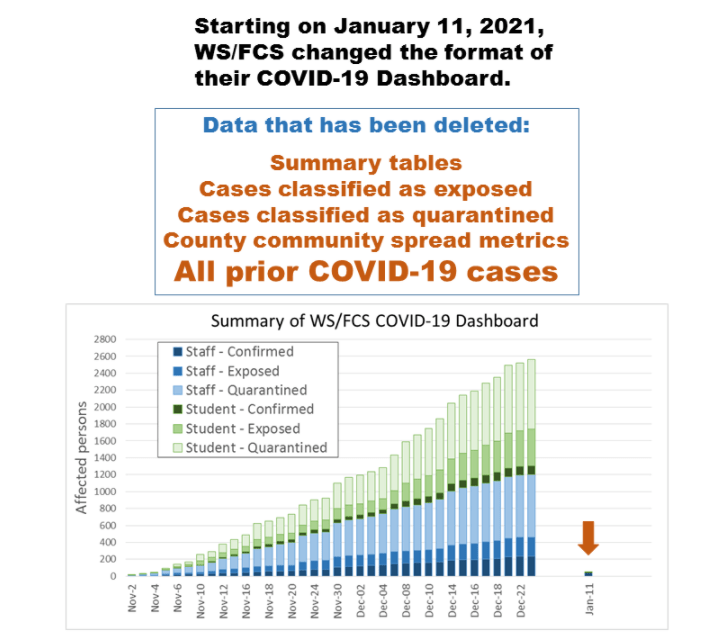
Then there is the fact that the dashboard used by the school system is the second iteration. On January 11th, WS/FCS changed the format of its dashboard.