State Superintendent Mo Green and DPI are discussing possibly changing the school performance grading system.
Again. This is not a new idea. It was talked about in 2024.

And now…

They don’t need to be changed; they need to be eliminated. For over ten years, this system of “measurement” has stigmatized public schools and has been used to create a false narrative that has fueled privatization efforts like vouchers.
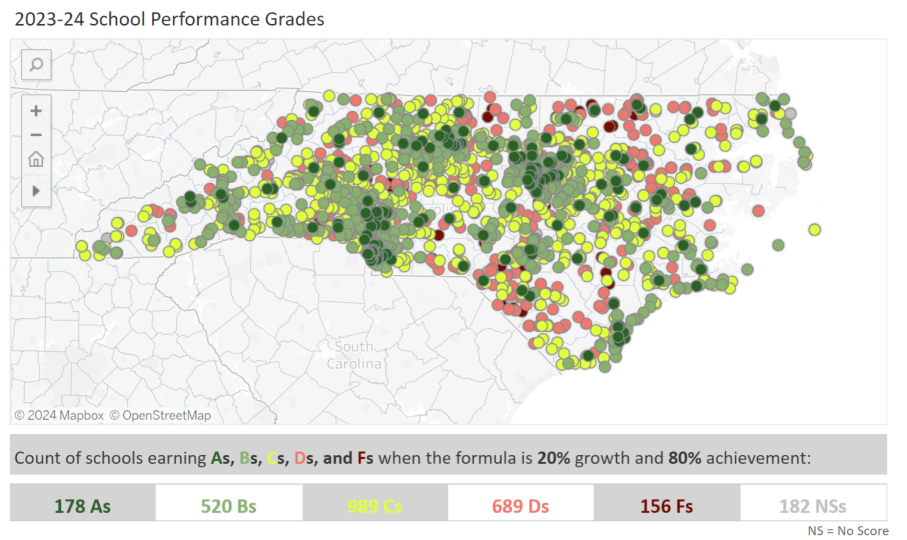
Remember that NC’s formula for calculating a school’s performance grade is weighted far more toward achievement than for growth (80/20). No other state in the country skews that much toward test results to “measure” school performance.
Such a formula does not really even properly measure the effectiveness of a school. Actually, those school performance grades as they are calculated measure nothing more than the very challenges that students and their families face that affect a student’s ability to learn.
Below is a map provided by EdNC.org that plots school performance grades across North Carolina for the 2023-2024 school year.
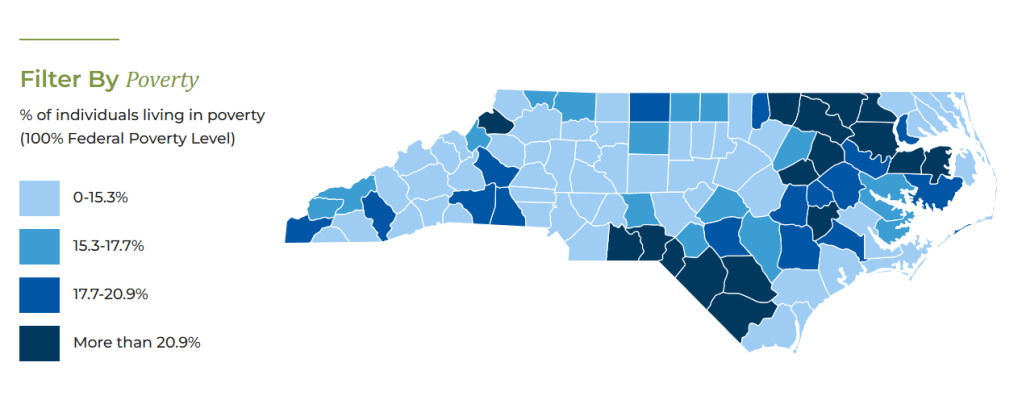
Next is a map of the economic well-being of each NC county as reported be the North Carolina Department of Commerce in 2023.
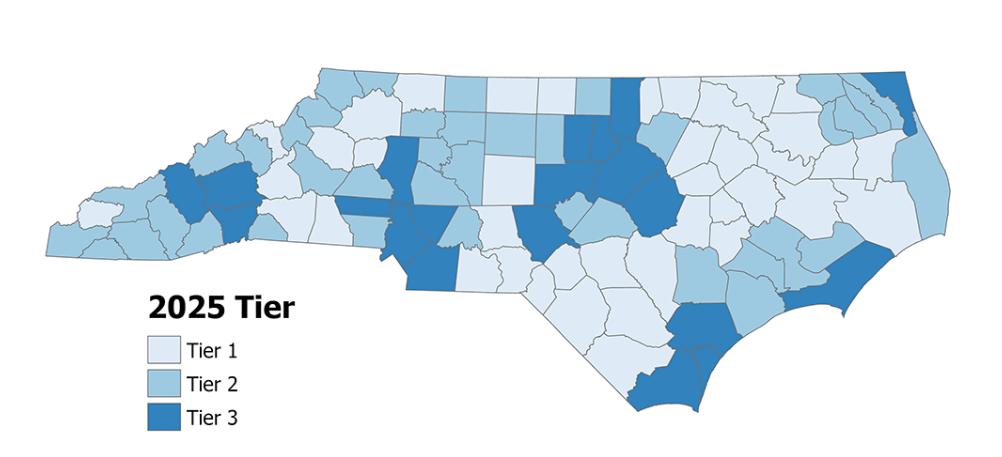
The LIGHTER the shade of gray, the more economic “distress.” This is how it was determined according to the site.
The North Carolina Department of Commerce annually ranks the state’s 100 counties based on economic well-being and assigns each a Tier designation. This Tier system is incorporated into various state programs to encourage economic activity in the less prosperous areas of the state.
The 40 most distressed counties are designated as Tier 1, the next 40 as Tier 2 and the 20 least distressed as Tier 3.
Review the 2025 County Tier Designations Memo.
County Tiers are calculated using four factors:
- Average unemployment rate
- Median household income
- Percentage growth in population
- Adjusted property tax base per capital
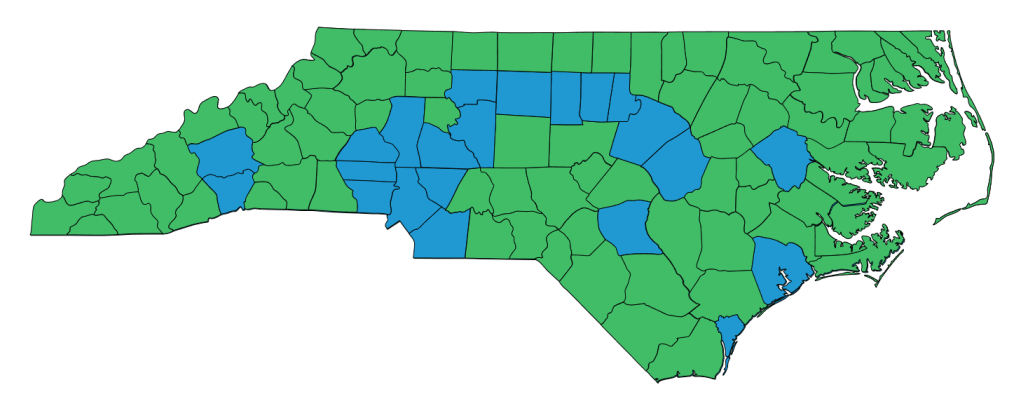
Below is a map that considers what areas in NC are considered rural (green counties are rural).
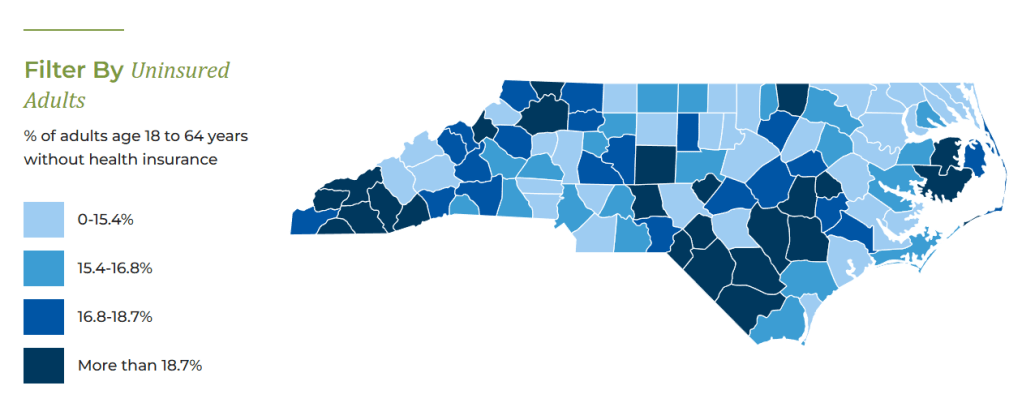
The maps below all come from the North Carolina Institute of Medicine.
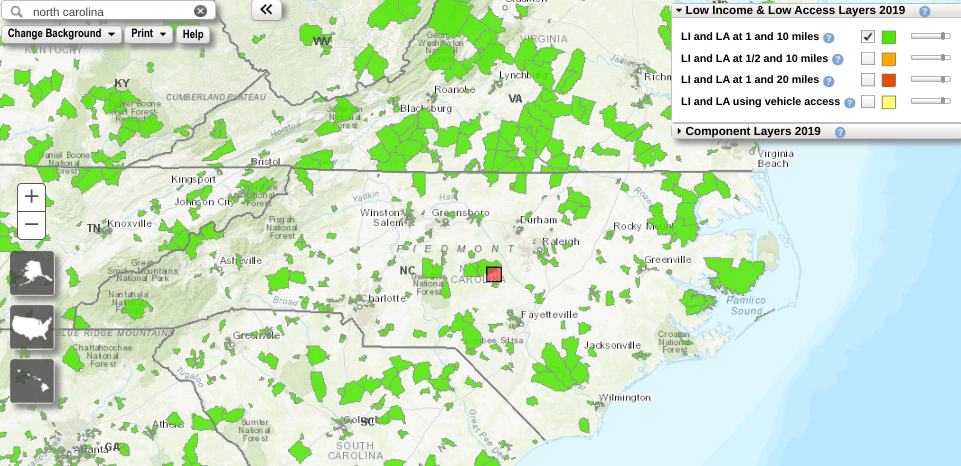
And this is from the USDA.gov. It concerns low access to grocery stores.
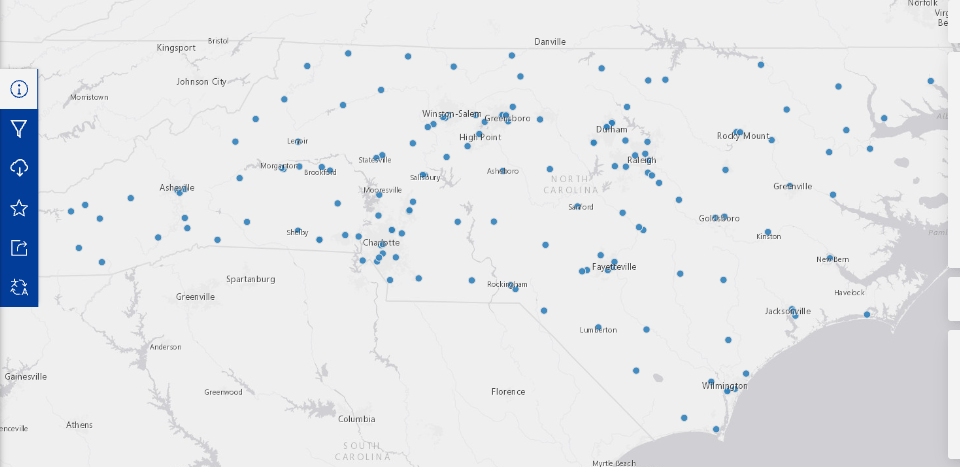
And then there is access to hospitals. From NC One Map:
Now go back to that map of the school performance grades.
See a pattern?
