Last year when DPI released the school performance grades for the state not included in the report was a data table that showed a correlation between poverty levels and school letter grades received.
Until last year, it had been. Maybe there was a trend that Mark Johnson’s office did not want to publicize.
Here’s a table detailing the link between these grades and poverty levels from 2015–16 Performance and Growth of North Carolina Public Schools Executive Summary, NC DPI.

Here’s a table detailing the link between these grades and poverty levels from 2016–17 Performance and Growth of North Carolina Public Schools Executive Summary, NC DPI.
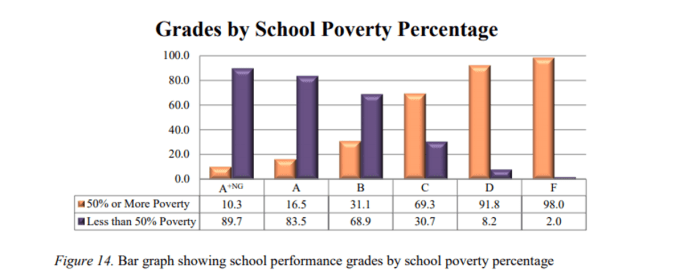
Last year’s report did not include the “Grades by School Poverty Percentage” bar graph, but the good people at the Public School Forum did the work for us.

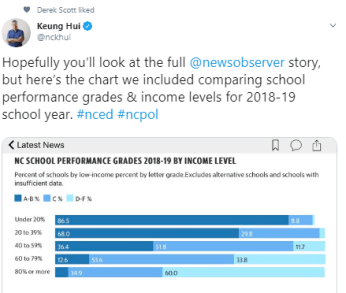
And this year, the News & Observer reported this:
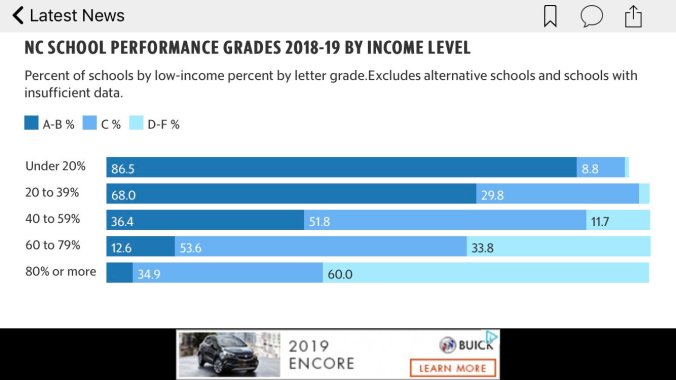
Sure does look like poverty levels still have a lot to do with school performance grades.
Makes one wonder why DPI’s budget was cut and those support positions were eliminated in DPI to help high-poverty LEA’s in 2018.
