Below are screenshots from the recently released PISA scores and rankings. And there are THREE BASIC CONCLUSIONS THAT CAN BE DRAWN:
- PISA SCORES ARE NOT REALLY A GOOD INDICATION OF THE STRENGTH OF AMERICAN SCHOOLS.
- PISA SCORES SHOW THAT “REFORMS” HAVE NOT WORKED.
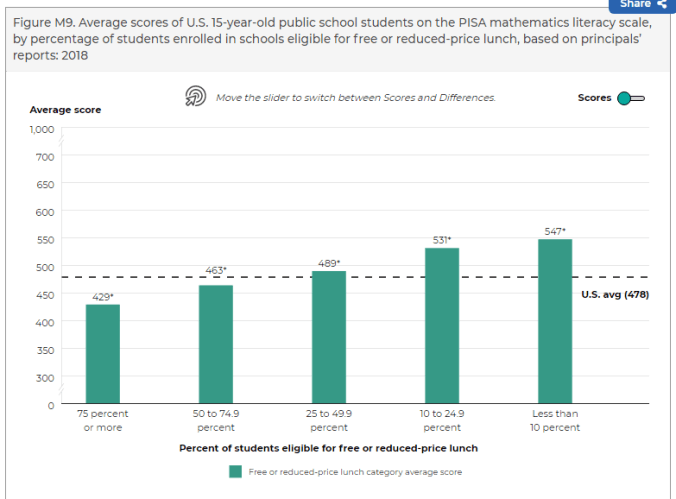
- PISA SCORES SHOW THAT POVERTY AND SOCIOECONOMIC FACTORS HIGHLY AFFECT EDUCATIONAL OUTCOMES.
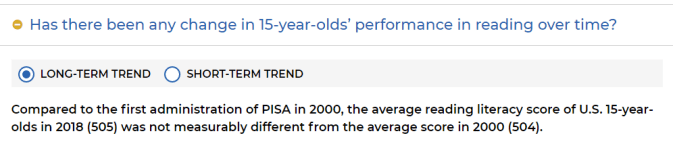
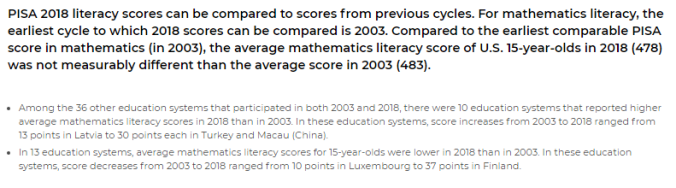
Notice that both of those screenshots say “was not measurably different than the average score in 2003.
- In 2001, we got No Child Left Behind. It’s still here.
- In 2009, we got Race to the Top.
- In 2015, we got the Every Student Succeeds Act.
- Add to that a lot of privatization.
Nothing has been “measurably different.”
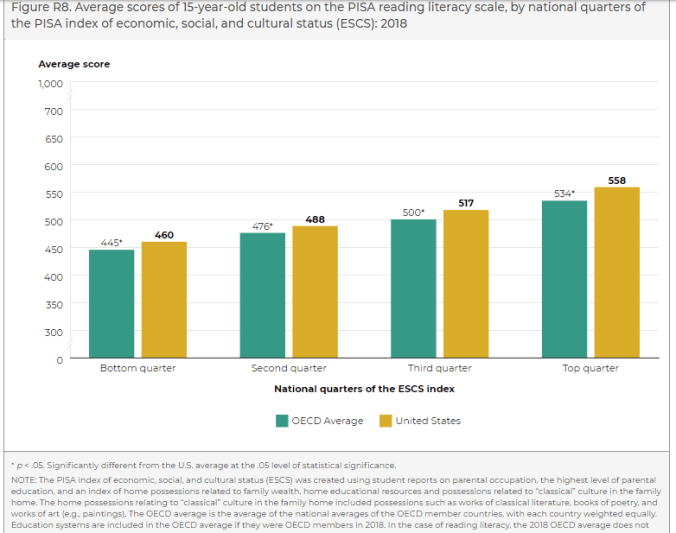
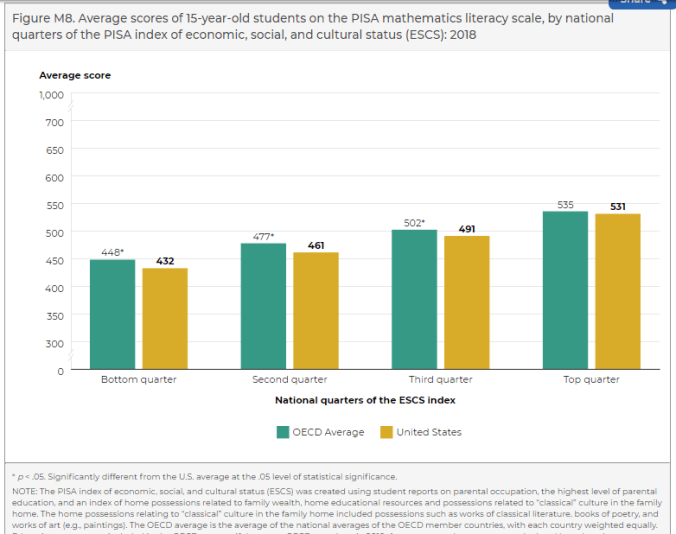
Now, look at the latest US results based on socio-economic and cultural factors.
Measuring the vitality of the American public school system by the Program for International Student Assessment score report is erroneous. But that doesn’t stop non-educators from spinning the data.
Remember this from Betsy DeVos from March of 2018?

That’s in reference to the last report on PISA scores (nothing has been said so far by her concerning this year’s release). What DeVos got wrong is that we as a country are not average. We actually do very well when one considers the very things that DeVos is blind to: income gaps, social inequality, and child poverty.
Bob Herbert wrote an iconic book published in 2014 called Losing Our Way. He explored three different facets of our country that are foundational but are deteriorating because we as a country are not investing in truly remedying them but rather politicizing them. One he talks about is public education.
In the chapter “Poverty and Education”, Herbert discusses a study by Richard Rothstein and Martin Carnroy entitled “What do international tests really show about U. S. student performance?” Published by the Economic Policy Institute, the researchers (as Herbert explains on page 155 of his book), “made a detailed study of the backgrounds of the test takers in an extensive database compiled by the Program for International Student Assessment (PISA).
From that actual report (and I would encourage any reader to take a look):
Because social class inequality is greater in the United States than in any of the countries with which we can reasonably be compared, the relative performance of U.S. adolescents is better than it appears when countries’ national average performance is conventionally compared.
- Because in every country, students at the bottom of the social class distribution perform worse than students higher in that distribution, U.S. average performance appears to be relatively low partly because we have so many more test takers from the bottom of the social class distribution.
- A sampling error in the U.S. administration of the most recent international (PISA) test resulted in students from the most disadvantaged schools being over-represented in the overall U.S. test-taker sample. This error further depressed the reported average U.S. test score.
- If U.S. adolescents had a social class distribution that was similar to the distribution in countries to which the United States is frequently compared, average reading scores in the United States would be higher than average reading scores in the similar post-industrial countries we examined (France, Germany, and the United Kingdom), and average math scores in the United States would be about the same as average math scores in similar post-industrial countries.
- A re-estimated U.S. average PISA score that adjusted for a student population in the United States that is more disadvantaged than populations in otherwise similar post-industrial countries, and for the over-sampling of students from the most-disadvantaged schools in a recent U.S. international assessment sample, finds that the U.S. average score in both reading and mathematics would be higher than official reports indicate (in the case of mathematics, substantially higher).
- This re-estimate would also improve the U.S. place in the international ranking of all OECD countries, bringing the U.S. average score to sixth in reading and 13th in math. Conventional ranking reports based on PISA, which make no adjustments for social class composition or for sampling errors, and which rank countries irrespective of whether score differences are large enough to be meaningful, report that the U.S. average score is 14th in reading and 25th in math.
- Disadvantaged and lower-middle-class U.S. students perform better (and in most cases, substantially better) than comparable students in similar post-industrial countries in reading. In math, disadvantaged and lower-middle-class U.S. students perform about the same as comparable students in similar post-industrial countries.
- At all points in the social class distribution, U.S. students perform worse, and in many cases substantially worse, than students in a group of top-scoring countries (Canada, Finland, and Korea). Although controlling for social class distribution would narrow the difference in average scores between these countries and the United States, it would not eliminate it.
- U.S. students from disadvantaged social class backgrounds perform better relative to their social class peers in the three similar post-industrial countries than advantaged U.S. students perform relative to their social class peers. But U.S. students from advantaged social class backgrounds perform better relative to their social class peers in the top-scoring countries of Finland and Canada than disadvantaged U.S. students perform relative to their social class peers.
- On average, and for almost every social class group, U.S. students do relatively better in reading than in math, compared to students in both the top-scoring and the similar post-industrial countries.
Because not only educational effectiveness but also countries’ social class composition changes over time, comparisons of test score trends over time by social class group provide more useful information to policymakers than comparisons of total average test scores at one point in time or even of changes in total average test scores over time.
- The performance of the lowest social class U.S. students has been improving over time, while the performance of such students in both top-scoring and similar post-industrial countries has been falling.
- Over time, in some middle and advantaged social class groups where U.S. performance has not improved, comparable social class groups in some top-scoring and similar post-industrial countries have had declines in performance.
The entire report can be found here.
You can peruse the PISA score reports just released here.

Pingback: Pearl Clutching Over PISA | Live Long and Prosper