“The transformation of our public education system will open true pathways out of poverty.”
– Mark Johnson, September 7th, 2016 from an op-ed entitled “Our American Dream” (https://www.ednc.org/2016/09/07/our-american-dream/).
This week State Superintendent of Public Schools Mark Johnson presented a new school report card interface and “updated features” so that the public can view school report cards (https://ncreportcards.ondemand.sas.com/src/index). It has a lot of bells and whistles.
The letter attached to its new release by Johnson seems well-meaning. The text can be found here – http://www.ncpublicschools.org/src/welcome/.
Yet, no matter how much glitter and glam can be used to create an interface that appeals to the eyes, it doesn’t cover up the fact that there really is so much more that makes up a school than a school report card in this state chooses to measure.
Yes, Johnson does make note in his letter that there is more to a school than a “grade.” He states,
“As a former teacher, I can tell you this information, while important, cannot tell you the entire story of a school. These facts and figures cannot voice the extra hours put in by your teachers preparing for class and grading assignments, the school spirit felt by families, the involvement in sports, arts, or other extracurriculars that build character, and other crucial aspects of a school community.”
But the school report cards still do not reflect those very considerations that give a school so much of its identity and define its true outreach to the students and the communities they serve. In fact, that is one of the many glaring items deficiencies that come to mind when reviewing the new interface.
- It totally ignores the fact that what affects so many schools is POVERTY.
As soon as one accesses the site, a map of the state is shown.
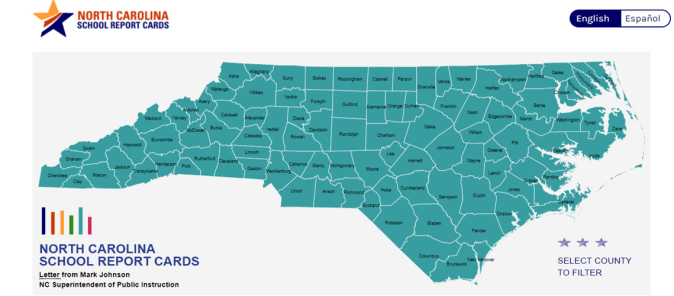
One can then drill down from there. But one has to wonder if there is any measurement of certain socio-economic trends besides the number of kids on free and reduced lunches.
What about the effects of the gerrymandering that has occurred in recent years in the drawing of districts? What about how the unconstitutional VOTER ID law affected how people could vote and put representatives in Raleigh who would fight more for their students?
EdNC.org has a useful tool on its site called the Data Dashboard. You can find it here – https://www.ednc.org/data/. Take the time to peruse this resource if public education is a top issue for you.
Here is a dot map of the 2014-2015 school performance grade map for the state (https://www.ednc.org/2015/08/03/consider-it-mapped-and-school-grades/) .

Take notice of the pink and burgundy dots. Those are schools in the “D” and “F” category.
Now look at a map from the dashboard for Free and Reduced lunch eligibility for the same year.

If you could somehow superimpose those two images, you might some frighteningly congruent correlations.
What if that capability was allowed within the new interface of the school report cards?
Now take a look again at the quote from Mark Johnson at the beginning of this posting:
“The transformation of our public education system will open true pathways out of poverty.”
I would argue that addressing poverty outside of class would help students inside of class as much if not more. Besides showing people how many textbooks there are per student (which is probably not correct as school systems are constantly shuffling textbooks around to cover the needs), what about the per capita measurements?
Education can help pull people out of poverty. I will not argue that, but attacking poverty at its root sources will do so much to help education. This revamped site seems to totally ignore that.
And maybe Johnson’s revamped school report site should also include this graph.
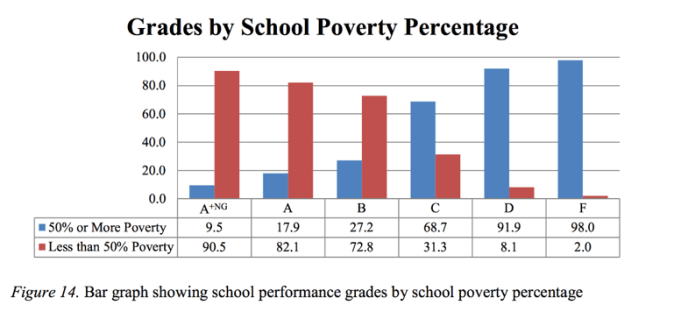
That is from the 2015–16 Performance and Growth of North Carolina Public Schools Executive Summary, NC DPI.
- This site is being used as a way to promote more privatization through the veiled crusade of SCHOOL CHOICE.
Mark Johnson is about “school choice.” He has said so.
Those school performance grades that appear so quickly when one drills down on a district are based on a model developed by Jeb Bush when he was in Florida. It’s disastrous and places a lot of emphasis of achievement scores of amorphous, one-time testing rather than student growth throughout the entire year.
It’s part of the “proficiency versus growth” debate that really came to the forefront during the Betsy DeVos confirmation hearings when she could not delineate between whether test scores are used to measure student “achievement” or student “growth.”
Consider this:
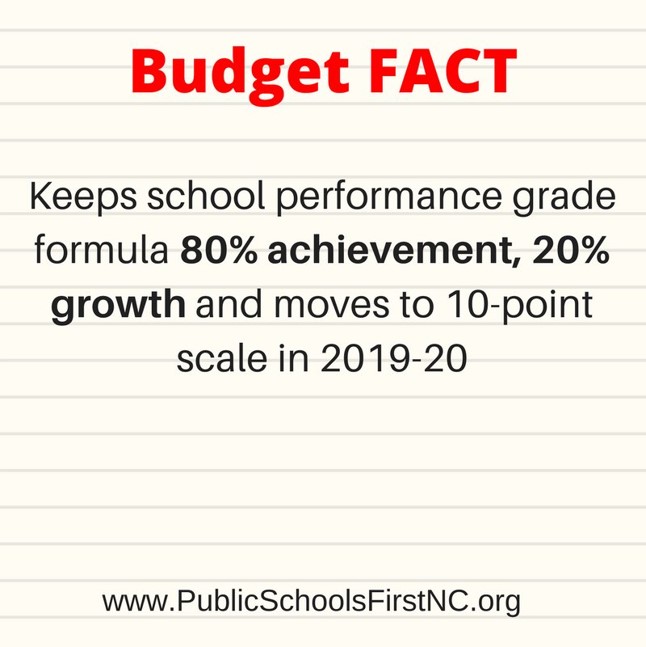
Interestingly enough, in the school year 2019-2020, the school performance grade scale will shift from a fifteen-point scale to a ten-point scale. Do you know what that means?
IT WILL BE HARDER FOR PUBLIC SCHOOLS TO QUALIFY AS PASSING. IN FACT, SCHOOLS COULD HAVE A HIGHER PERCENTAGE OF STUDENT GROWTH AND STILL GET A LOWER SCHOOL PERFORMANCE GRADE! AND THE SCHOOL REPORT CARD SITE WILL HIGHLIGHT THAT!
There will be more failing schools. This comes from a legislative body that endorsed the state board last school year to institute a ten-point scale for all high school grading systems to help ensure higher graduation rates, but now shrinks scales for those schools’ performance grades.
This comes from the same legislative body that literally is propping up the very state superintendent who is championing this very site.
Guess what else is happening in 2019-2010? Voucher expansion! From the recent session that gave us our current budget:
SECTION 6.6.(b) G.S. 115C-562.8(b) reads as rewritten: “(b) The General Assembly finds that, due to the critical need in this State to provide opportunity for school choice for North Carolina students, it is imperative that the State provide an increase of funds of at least ten million dollars ($10,000,000) each fiscal year for 10 years to the Opportunity Scholarship Grant Fund Reserve. Therefore, there is appropriated from the General Fund to the Reserve the following amounts for each fiscal year to be used for the purposes set forth in this section:
Fiscal Year Appropriation
2017-2018 $44,840,000
2018-2019 $54,840,000
2019-2020 $64,840,000
2020-2021 $74,840,000
2021-2022 $84,840,000
2022-2023 $94,840,000
2023-2024 $104,840,000
2024-2025 $114,840,000
2025-2026 $124,840,000
2026-2027 $134,840,000
Bottom line is that this site is helping to fuel the slanted and loaded argument that what this state needs more of is SCHOOL CHOICE! However, what is happening in this state is that “school choice” really is a euphemism for unregulated charter schools and vouchers – neither of which have produced results that show improvement for student achievement.
- The site is maintained by SAS.
Look at the web address – https://ncreportcards.ondemand.sas.com/src/. That “sas” represents SAS, the same SAS that controls EVAAS which measures schools by a secret algorithm. That “.com” means it’s maintained by a commercial entity. It gets paid taxpayer money.
Back to Johnson’s letter accompanying the new website:
“We launched the new website, a completely redesigned online resource that provides the transparency you need into the characteristics and performance of your school in an easy-to-use format, to better inform you. I encourage you to follow the link to a school’s individual website to find out more about the school’s full story.”
There’s a word there called “transparency.” EVAAS is the very epitome of not being transparent.
Actually, it is rather mindboggling to think that a measurement which comes from EVAAS is so shrouded in so much opaqueness. With the power to sway school report cards and school performance grades, it would make sense that there be so much transparency in how it calculates its data so that all parties involved would have the ability to act on whatever needs more attention.
And people are literally invited to take action on the data presented by the school report card website. In fact, SAS’s measurement slaps you in the face as soon as you choose a district or school.
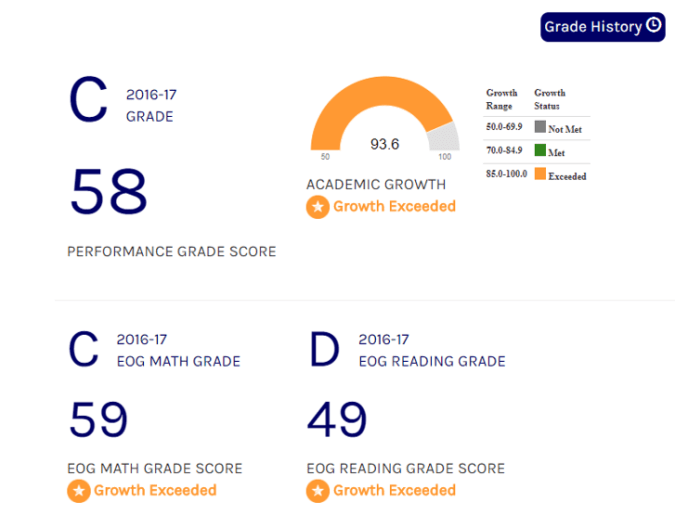
In fact, if one chooses to look at a district, then all schools are displayed according by color to whether they met growth and with a large letter grade. It’s like they are already being compared against each other when the very makeup of the schools and the obstacles each faces could differ a lot.
Think about what a school report card might not show.
- Does the school report card show how successful graduates are in post-secondary educational endeavors like Virginia which has dropped the performance grading system?
- Does the school report card consider the viewpoints of the parents whose students are being taught? school report card
- Does the school report card consider the viewpoints of the students and how they feel about the learning experience and their security in the school and the classroom?
- Does the school report card consider how many students are taking “rigorous” courses?
- Does the school report card consider the amount of community service done by students in the school?
- Does the school report card consider the strength of the drama department and the quality of the productions?
- Does the school report card consider what is seen in the yearbook?
- Does the school report card consider the strength of the student newspaper?
- Does the school report card consider the strength of the JROTC program?
- Does the school report card consider the number of viable clubs and organizations on campus?
- Does the school report card consider the amount of scholarship money won by graduating students?
- Does the school report card consider the number of student participating in sports?
- Does the school report card consider the number of foreign languages offered?
- Does the school report card consider the number of students in the Student Section at a game?
- Does the school report card consider the number of students who wear spirit wear?
- Does the school report card consider the number of students involved in choral and musical endeavors?
- Does the school report card consider the number of students who attend summer academic study opportunities?
- Does the school report card consider the quality of the artistic endeavors of students through visual and performance arts programs?
- Does the school report card consider the strength of programs that hope to help marginalized students?
- Does the school report card consider the transient rate of the student body?
- Does the school report card consider the poverty levels of the surrounding area that the school services?
- Does the school report card consider the number of students who hold jobs?
- Does the school report card consider the effect of natural disasters such as hurricanes?
- Does the school report card consider the funding levels of the programs?
- Does the school report card consider the number of students on 504 plans or IEP’s?
- Does the school report card consider the rations of nurses and counselors to students?
- Does the school report card consider the class sizes?
Yes, this new interface for the school report cards of NC’s public schools looks modern and it does show data in a more eye-friendly manner, but what it really displays is how unwilling this current crop of policy makers are in confronting what really affects our schools, especially poverty.
It also is proof that Mark Johnson is more interested in the appearance of doing well.
And appearances are deceiving.
