Below is a map provided by EdNC.org that plots the most recent school performance grades across North Carolina.

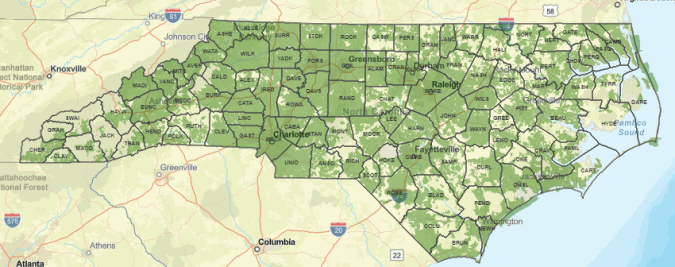
Below is the latest available map from NC DIT of broadband internet availability.
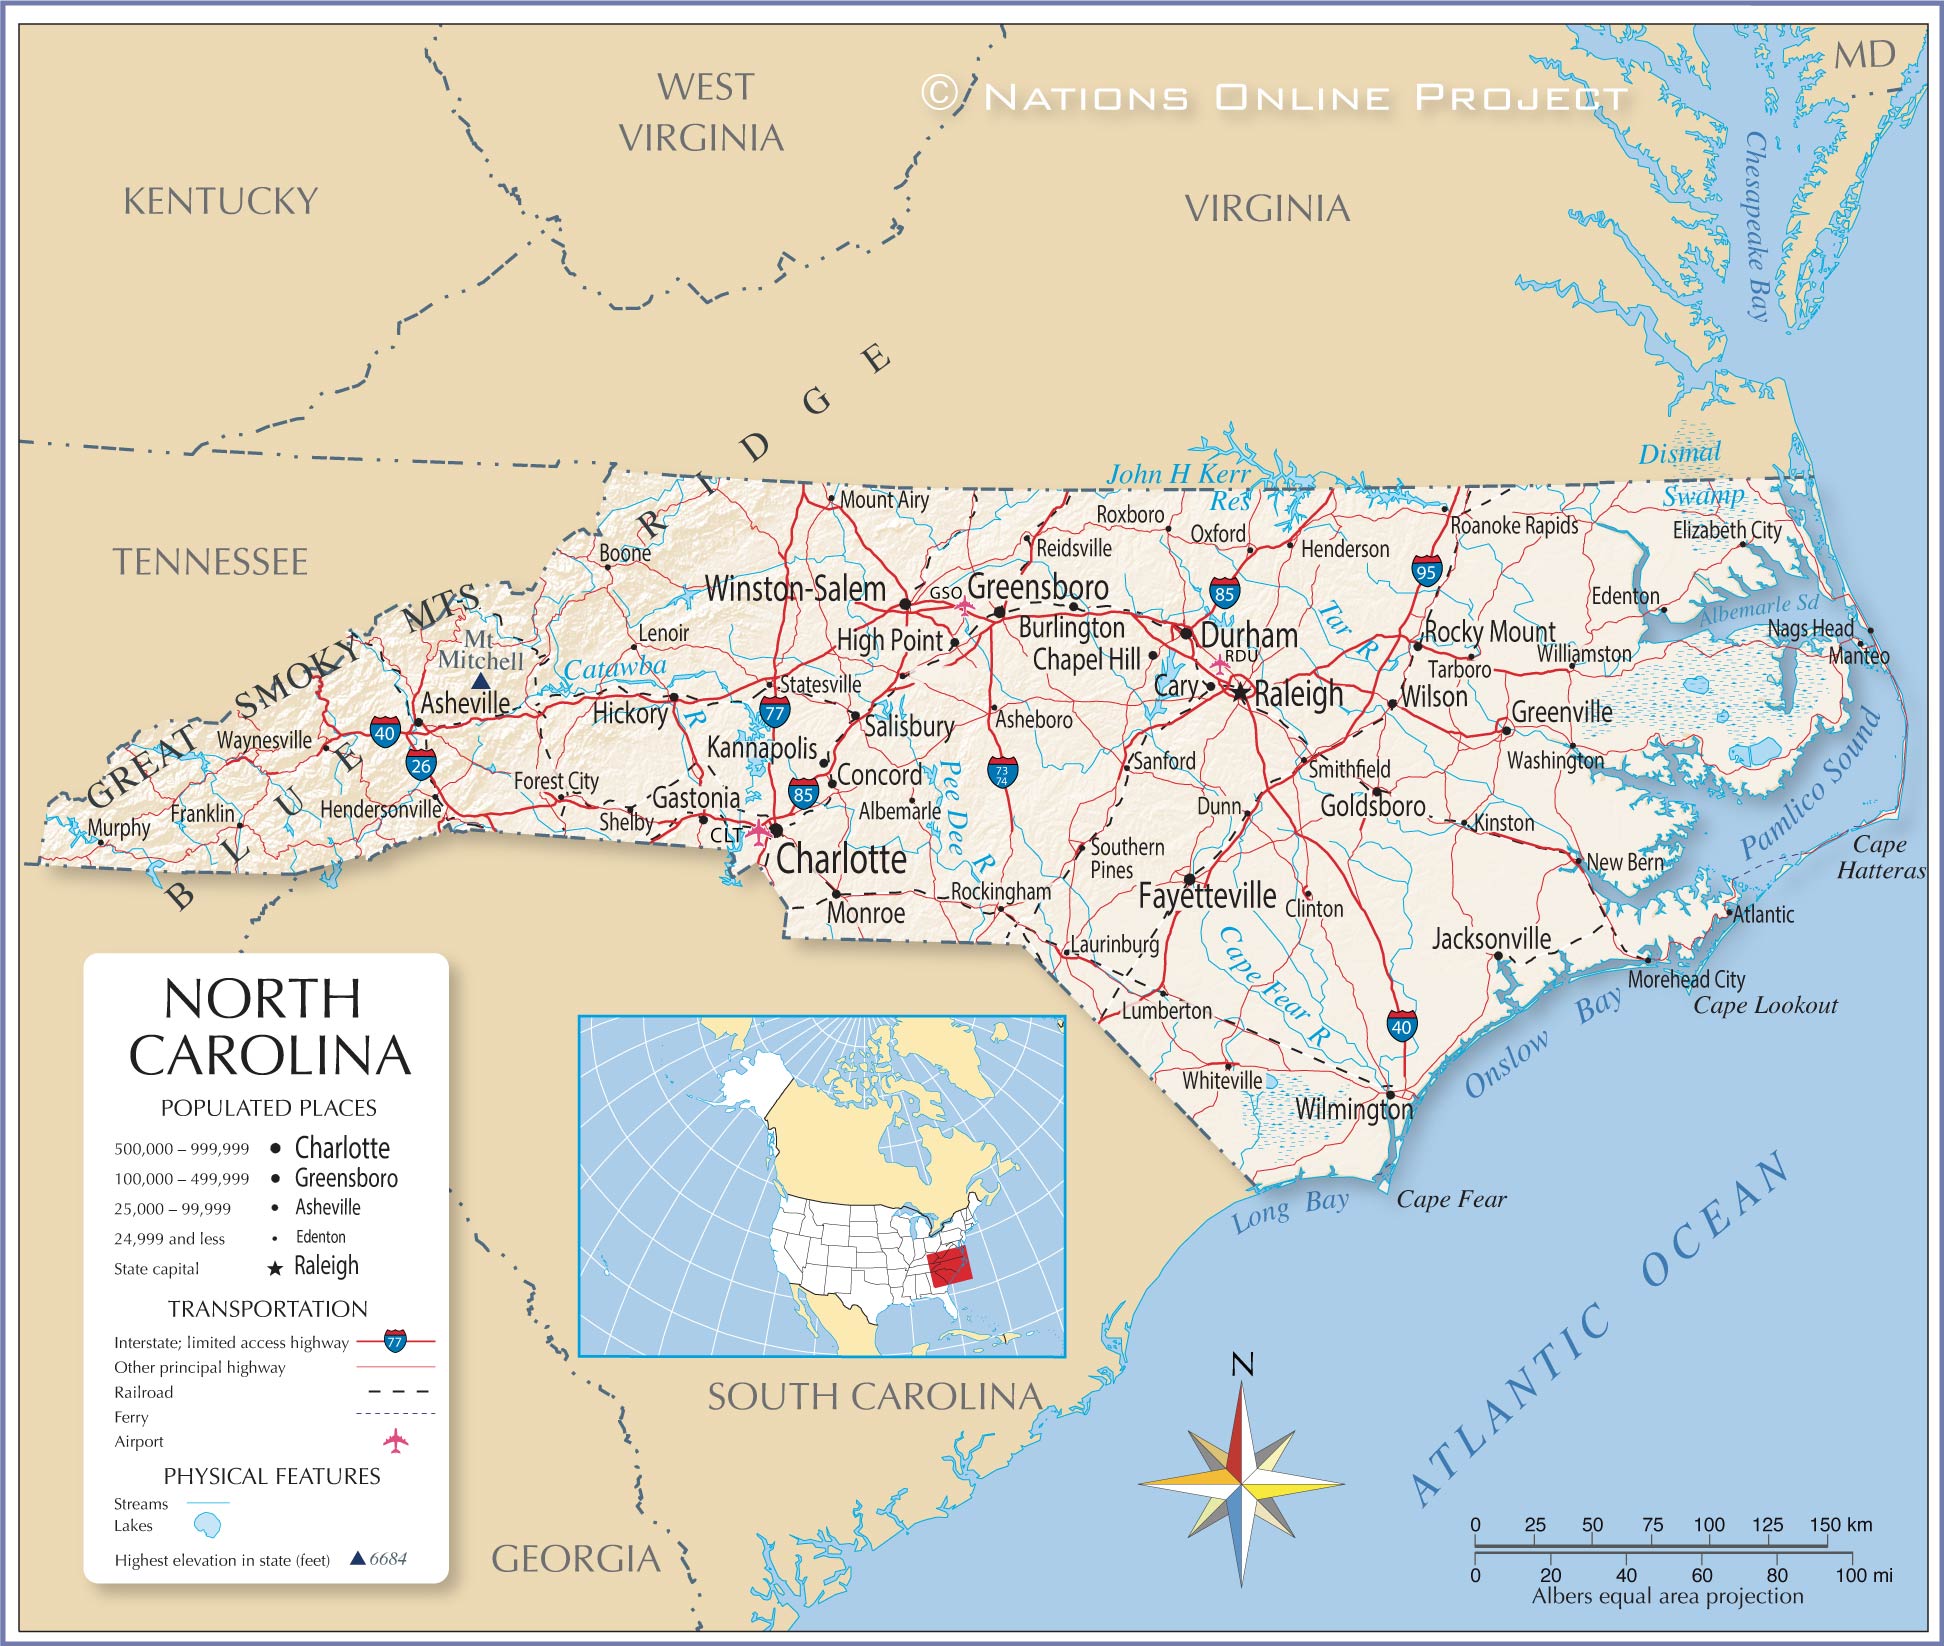
And consider where some of the larger cities in North Carolina are and their proximity to other “metro” areas.
Now superimpose the school performance grades with the broadband availability map.

There’s a strong correlation. Those who have connectivity at home can use it to help them with school and all schools have connectivity.
But in the event of distance learning, each home where a student lives becomes a (home)school. There’s lots of white still in those rural areas where there is no connectivity.
And before the virus even hit in a time of “economic” boom in the state there was this – a map of the economic well-being of each NC county as reported be the North Carolina Department of Commerce.

The LIGHTER the shade of blue, the more economic “distress.”
Hard to make a case that going to distance learning has not widened to chasm of the effects of poverty and lack of resources for many in this state. And many want to make distance learning more of the norm.
