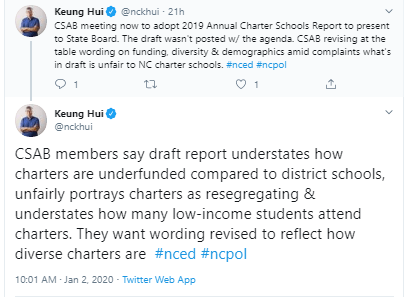
“CSAB members say draft report understates how charters are underfunded compared to district schools, unfairly portrays charters as resegregating & understates how many low-income students attend charters. They want wording revised to reflect how diverse charters are.”
This statement from Hui’s tweet from yesterday (1/2/2020) concerning the yearly CSAB report is reminiscent of what happened four years ago when Lt. Gov. Dan Forest made sure to present charter schools in a positive light no matter the truth. Remember this from 2016?
State education leaders sidetracked a report describing the overall student population at North Carolina’s charter schools as whiter and more affluent than student bodies at traditional public schools after Lt. Gov. Dan Forest complained it was too negative.
Four years later and its the same thing.
In a EdNC.org op-ed this past fall, Rhonda Dillingham, Executive Director of the North Carolina Association for Public Charter Schools, defended North Carolina’s charter schools from repeated criticism concerning perpetuating segregation.
She said,
“Since then (1996), charter schools, which will always be free and open to all, have offered exceptional student learning environments and created opportunities for all students nationwide — and especially in North Carolina. The facts speak for themselves; in three key metrics — student-family wellbeing, academic performance, and diversity — charter schools are a beacon.”
She also said,
“On top of that, charters in our state are serving virtually the same percentage of black and white students as district schools (and only a slightly lower percentage of Hispanic students).”
As well as,
“Today, as I look at the excellent work charter schools are doing in our state, I can confidently say that they have become active mobilizers in the ongoing fight for diversity and cultural competency in education. Indeed, cultivating schools that are diverse and capable of serving all students regardless of their race is central to the core missions of charter schools in North Carolina. And many public charter schools, recognizing that students from underserved backgrounds were not receiving the quality of education they deserve, have gone a step further, implementing plans to diversify their student bodies.”
As far as academic achievement in charters is concerned, Ms. Dillingham can explain this in another op-ed (credit: Kris Nordstrom):

And how charters are funded is also another topic that needs its own exploration (as long as charters openly show how they get all of their funds). But it is the word “diversity” that will be the focus here.
Baker Mitchell of the Roger Bacon Academies made a similar argument in the Wall Street Journal a few months back. His outfit operates four of the charter schools in NC.
When considering the context in which his schools operate, the actual student body makeup compared to other geographically close schools, and Mitchell’s loyalty to privatization efforts in North Carolina of public education, then it is easy to see how baseless an argument he has.
Dillingham’s argument about how “diverse” NC’s charter schools are is about as baseless.
It would be nice if Ms. Dillingham would define what “diversity” is in her own words because in looking at the populations of the charter schools’ student bodies from the last recorded NC State Report Card tables, NC’s charter schools are not really showing as much diversity as she may want people to believe.
This is the breakdown of Pupil Membership By Race for NC over the last few years.

For the 2017-2018 school year it was:
1.2% American Indian
3.3% Asian
17.4% Hispanic
25.3% Black
48.4% White
4.23% Two or More Races
1% Pacific Islander
According to the NC State Report Cards for Schools, 44.3% of students across the state are economically disadvantaged.
The Excel spreadsheet that follows this post (as a link) is a list of every charter school that exists now in this state that had a school performance grade attached to it for the 2018-2019 school year. It is cross-referenced to the last full school report card it has on record from the 2017-2018 school year.
That school report card has the breakdown of each charter school’s student body by race and economic disadvantage.

Please notice that “5%” is the lowest number allowed in a category. It could mean that there is anywhere from 0-5% in that given category.
In the Excel spreadsheet next to each school, these numbers are recorded in the order presented in the school report card for each of the 173 charter schools whose information is available.
Column I – American Indian
Column J – Asian
Column K – Black
Column L – Hispanic
Column M – Pacific Islander
Column N – Two or More Races
Column O – White
Column P – Economically Disadvantaged
Column Q – English Language Learners
Column R – Students With Disabilities
(Column F – This Shows of it is a Title I School. Title I funds can be given to charter schools, albeit a different formula than traditional schools. All but 51 of the charters with student makeup info are Title I schools.
Column G – This is the number of days missed from hurricanes last school year.)
And remember that the average across the state for all schools in NC 2017-2018 was:
1.2% American Indian
3.3% Asian
17.4% Hispanic
25.3% Black
48.4% White
4.23% Two or More Races
1% Pacific Islander
44.3% Economically Disadvantaged
According to the data table below which includes 173 charter schools,
- 81 of them had a student population that was at least 65% white.
- 40 of them had a student population that was at least 80% white.
- 100 of them had at least 50% of the students classified as white.
- 31 of them had a student population that was at least 65% black.
- 17 of them had a student population that was at least 80% black.
- 43 of them had at least 50% of the students classified as black.
To put in perspective, that means:
- Over 110 of the 173 charter schools had a student population that was at least 65% one race/ethnic group.
- 150 of the 173 charter schools had a student population that was at least 50% one race/ethnic group.
- Over 50 of the 173 charter schools had a student population that was at least 80% one race/ethnic group.
- 132 of the 173 schools listed had a 2017-2018 student population that was lower than 40% Economically Disadvantaged.
And remember that there is a strong correlation on the state level between school performance grades and levels of poverty in schools. Charters show just as much evidence as traditional schools.
- Of the 20 schools that received an “A” on the 2018-2019 School Performance Grade scale, 18 of them were at least 57% white the year before.
- Of the 59 schools that received a “B” on the 2018-2019 School Performance Grade scale, 48 of them were at least 60% white the year before.
- Of the 11 schools that received an “F” on the 2018-2019 School Performance Grade scale, only one had a population of at least 50% white.
- Of the 31 schools that received a “D” on the 2018-2019 School Performance Grade scale, only 5 were majority white.
Charters With Race Makeup From 2018 SRC

Pingback: The Charter School Advisory Board Of North Carolina Removes Section On Racial Impacts Of Charters | caffeinated rage