Another disingenuous “explanation” of the overall success of charter schools here in North Carolina appeared on EdNC.org this week.
And it invoked Mark Twain.
![]()
This one was penned by Lindalyn Kakadelis, the Executive Director of the North Carolina Coalition for Charter Schools. In an effort to “rebut” the criticism of the latest Charter School Advisory Board’s decision to not include demographic data on charter school student bodies, Kakadelis rehashed a few of the same debunked talking points that have appeared of late by Rhonda Dillingham and Sen. Deanna Ballard.
Dillingham, the Executive Director of the North Carolina Association for Public Charter Schools, defended North Carolina’s charter schools from criticism concerning perpetuating segregation back in September of 2019 on EdNC.org. In it she claimed,
“On top of that, charters in our state are serving virtually the same percentage of black and white students as district schools (and only a slightly lower percentage of Hispanic students).”
As well as,
“Today, as I look at the excellent work charter schools are doing in our state, I can confidently say that they have become active mobilizers in the ongoing fight for diversity and cultural competency in education. Indeed, cultivating schools that are diverse and capable of serving all students regardless of their race is central to the core missions of charter schools in North Carolina. And many public charter schools, recognizing that students from underserved backgrounds were not receiving the quality of education they deserve, have gone a step further, implementing plans to diversify their student bodies.”
Dillingham’s argument about how “diverse” NC’s charter schools was somewhat baseless.
It would be nice if Ms. Dillingham would define what “diversity” is in her own words because in looking at the populations of the charter schools’ student bodies from the last recorded NC State Report Card tables, NC’s charter schools are not really showing as much diversity as she may want people to believe.
The Excel spreadsheet linked here (Charters With Race Makeup From 2018 SRC) is a list of every charter school that exists now in this state that had a school performance grade attached to it for the 2018-2019 school year. It is cross-referenced to the last full school report card it has on record from the 2017-2018 school year.
Those school report cards have the breakdown of each charter school’s student body by race and economic disadvantage.
According to the Excel spreadsheet’s data which includes 173 charter schools,
- 81 of them had a student population that was at least 65% white.
- 40 of them had a student population that was at least 80% white.
- 100 of them had at least 50% of the students classified as white.
- 31 of them had a student population that was at least 65% black.
- 17 of them had a student population that was at least 80% black.
- 43 of them had at least 50% of the students classified as black.
To put in perspective, that means:
- Over 110 of the 173 charter schools had a student population that was at least 65% one race/ethnic group.
- 150 of the 173 charter schools had a student population that was at least 50% one race/ethnic group.
- Over 50 of the 173 charter schools had a student population that was at least 80% one race/ethnic group.
- 132 of the 173 schools listed had a 2017-2018 student population that was lower than 40% Economically Disadvantaged.
And remember that there is a strong correlation on the state level between school performance grades and levels of poverty in schools. Charters show just as much evidence as traditional schools.
- Of the 20 schools that received an “A” on the 2018-2019 School Performance Grade scale, 18 of them were at least 57% white the year before.
- Of the 59 schools that received a “B” on the 2018-2019 School Performance Grade scale, 48 of them were at least 60% white the year before.
- Of the 11 schools that received an “F” on the 2018-2019 School Performance Grade scale, only one had a population of at least 50% white.
- Of the 31 schools that received a “D” on the 2018-2019 School Performance Grade scale, only 5 were majority white.
That doesn’t really back up Dillingham’s claims.
The next month, Sen. Deanna Ballard stated in a Center Point article many of the same claims that Dillingham did.
Ballard said the racism claims are the critics “last hope for killing school choice,” but she thinks it is a shot in the dark.
Enrollment numbers in North Carolina paint a different picture from the “white flight” that Mangrum described, according to Ballard.
About 20 percent of school-aged children do not attend traditional public schools, according to state numbers. The charter schools have a higher percentage of African-American students than public schools do.
The Center Square confirmed that 26.1 percent of charter school students in North Carolina are African-American, and African-American students make up 25.1 percent of the public school population.
Sen. Ballard represents parts of five counties in northwestern NC: Alleghany, Ashe, Surry, Watauga, and Wilkes. Those counties house three of the over 170 charter schools in the state. Those charter schools are Bridges Academy in Wilkes County, Milennium Charter Academy in Surry County, and Two Rivers Community School in Watauga County.
Maybe it would be a good idea to see how the student makeup of each of these charter schools compares to nearby public schools. In this post, the site SchoolDigger.com was used. Each charter school in Ballard’s district was entered into the same search fields.
Here is what was found.


Millenium Charter: 15.7 free and reduced lunch. Take a look at the table above of the nearest high schools – particularly Mount Airy High School which is the closest one.
Compare the percentages of student makeup.
Here’s Two Bridges compared to other close elementary schools. Again, take a look at the percentages of Free/Discounted Lunch Recipients and race makeups.

Here’s Bridges Academy.


Of the three above, two are starkly different in student makeup than other nearby schools. Only Bridges Academy seems to have the same student makeup as nearby schools. But would that have anything to do with the lack of diversity in Wilkes County?
But two of three school in her district portray a vastly different image than the one she proffers in her words within the Center Point article.
Actually, those two schools prove her words wrong.
Kakadelis went one step further. Not only did she make the same claims about the demographics of North Carolina’s charter schools – she said they performed better. But she does not show a real investigation of the data.
In her op-ed Kakadelis states,
Charter schools make efforts to reflect the population of the local system in which they are located. However, it is essential to remember that charter schools are public schools of choice with no enrollment boundary. In fact, families often cross county lines to attend these public schools of choice.
This leads to another factor of reporting complexity when comparing charters to a specific county school system: Charter schools may draw students from multiple counties and thus may not have student enrollments that are reflective, exclusively, of the county system in which these schools are located.
Interesting that she states that charter schools may draw students from multiple counties. It reminded me of Kris Nordstrom’s work from 2016, “Charter schools already receive more than their fair share of local funding” for the NC Justice Center. In it he explained how “per student local funding provided to charter schools is based on the per student local funding from where the students in that charter school live.” If a charter school draws students from multiple counties, then multiple counties will have less money to fund their traditional schools depending on the number of students who go to the charter schools.
Furthermore, right after that she talks about how charter schools have a harder time giving transportation to students. Money for transportation is a whole other matter in budgeting, but in this context, it seems that she is saying that charter schools mostly have students who can only provide their own transportation. Students whose families cannot make that investment can not easily go to the charter school.
And our school performance grades have already shown that schools with higher levels of poverty have lower SPGs.
Then Kakadelis offers this:

She seems to equate achievement with growth, when growth is a better indicator of how well schools do with the students they teach. From Kris Nordstrom:
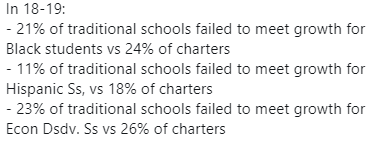
In fact, here is a better indication of charters versus traditional schools when looking at growth (also from Nordstrom).

So Mark Twain is rather applicable here.

The problem is that Kakadelis chooses not to look at all of the facts.

Let’s change the conversation — just shift it a bit. 1) There is no monolithic charter school — generalized statements about them are not useful – you are comparing apples to oranges to kiwis. Instead, consider whether these comments are polarizing and politicizing educiton in a way that is also not helpful. Just my opinion — (and, full disclosure) I am a teacher of 16 years who has worked in two different charter schools (vastly different form each other) and two different county systems (also vastly different from each other).
LikeLike
Oops, sorry — hit enter too soon. More to think about: 2) we could talk about – and address — the reasons that PARENTS and CARETAKERS seek charter school spots for their children. That conversation will yield some insight. Really — why do they want them? I don’t care why Republicans and Democrats do and don’t want them. I just don’t. Too much energy spent on useless conversations and debate. Why is charter school enrollment a desirable option in the perspective of those who send their children off to school every day? What does it tell us about what needs to be done in our schools? And 3) Why have we made ZERO effort to use excellent schools’ (whatever type) practices to figure out how to serve our children? Or if the effort has been made, why are we not focusing on making it possible to make those changes? 4) The exercise of blatant self interest and lack of vision and even ethics — by political parties, political leaders, and educational administrators is appalling and spells doom for our children. Mark Johnson only beat me by 800 votes in 2014, and I’m pretty sure he needed that in order to bounce to his current spot. His appeal to the voters, and backing by the Republican party, have been instructive. The lack of vision by the local Democratic party is also instructive. The Superintendent of Schools in my county exploded administrative staff as she cut important classroom programs and positions, and then she went to Raleigh to work with that incompetent we have for a superintendent. It just goes on and on. Just stop and think.. Where does your energy and attention belong? Where do you want to direct your well-deserved and brilliant megaphone? What would really matter? What change could be made, below the surface, that would send things in a different direction? That is a conversation I would love to have. Let’s sepnd our intellect and energy working on understanding an resolving instead of screaming about a consequence that is not going to change. Forward. You can’t change the path of a river, but you can learn to navigate and then use it to arrive at your destination.
LikeLike
Ms. Fansler, sounds like you might be running for school board here in Forsyth again.
LikeLike